0%

Golang的GC的回收

​ Golang Gc相关!

程序启动

​ Go程序启动,首先绝对是初始化一堆资源,关于如何启动需要看Go的转汇编代码了 !

1
2
3
4
5
6
7
8
9
10
11
12
13
14
15
// The bootstrap sequence is:
//
// call osinit
// call schedinit
// make & queue new G
// call runtime·mstart
//
// The new G calls runtime·main.
func schedinit() {
// raceinit must be the first call to race detector.
// In particular, it must be done before mallocinit below calls racemapshadow.
//...
gcinit()
//...
}

首先在一个Go程序启动的时候会调用 https://golang.org/src/runtime/proc.go ,大致启动逻辑就和这个注释上一样,会先启动os,然后schedle,然后再启动

gc初始化

1
2
3
4
5
6
7
8
9
10
11
12
13
14
15
16
17
18
19
20
21
22
23
func gcinit() {
if unsafe.Sizeof(workbuf{}) != _WorkbufSize {
throw("size of Workbuf is suboptimal")
}

// No sweep on the first cycle.
mheap_.sweepdone = 1

// Set a reasonable initial GC trigger. 核心关注与这个!就是触发GC回收的阈值,默认是0.875
memstats.triggerRatio = 7 / 8.0

// Fake a heap_marked value so it looks like a trigger at
// heapminimum is the appropriate growth from heap_marked.
// This will go into computing the initial GC goal.
memstats.heap_marked = uint64(float64(heapminimum) / (1 + memstats.triggerRatio))

// Set gcpercent from the environment. This will also compute
// and set the GC trigger and goal.
_ = setGCPercent(readgogc())

work.startSema = 1
work.markDoneSema = 1
}

1、triggerRatio

Set a reasonable initial GC trigger. 核心关注与这个!就是触发GC回收的阈值,默认是0.875,含义是这次堆中存活的对象是上一次的 1+(7/0.8)值要大的时候就回收

假如上次完成后堆内存是 100M 现在是 200M,此时 (200M-100M)/100M>7/0.8的,所以需要进行回收!
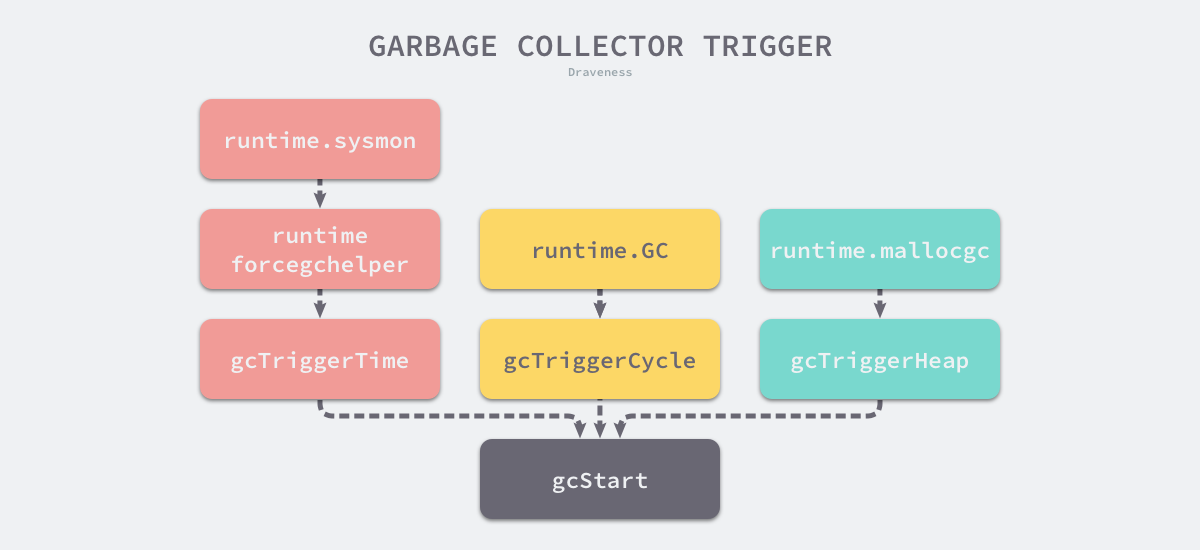
具体这个值可以根据GOGC/100 进行设置,根据具体业务来,GOGC = off将完全禁用垃圾收集

2、heapminimum

heapminimum是触发GC的最小堆大小。

在初始化期间,此设置为4MB * GOGC / 100

GC执行分类

gogc 执行会分配下面大致几类

  • gcTriggerHeap
  • gcTriggerTime
  • gcTriggerCycle

garbage-collector-trigger

1
2
3
4
5
6
7
8
9
10
11
12
13
14
15
16
17
18
19
20
21
22
23
func (t gcTrigger) test() bool {
if !memstats.enablegc || panicking != 0 || gcphase != _GCoff {
return false
}
switch t.kind {
case gcTriggerHeap:
// Non-atomic access to heap_live for performance. If
// we are going to trigger on this, this thread just
// atomically wrote heap_live anyway and we'll see our
// own write.
return memstats.heap_live >= memstats.gc_trigger // heap中存活的对象大于gc需要触发的阈值(这个阈值时上一次gc设置的)
case gcTriggerTime:
if gcpercent < 0 {
return false
}
lastgc := int64(atomic.Load64(&memstats.last_gc_nanotime))
return lastgc != 0 && t.now-lastgc > forcegcperiod // 当前时间与上次gc时间相差2分钟
case gcTriggerCycle:
// t.n > work.cycles, but accounting for wraparound.
return int32(t.n-work.cycles) > 0
}
return true
}

1、周期性GC

1
2
3
4
5
6
7
8
9
10
11
12
13
14
15
16
17
func forcegchelper() {
forcegc.g = getg()
for {
lock(&forcegc.lock)
if forcegc.idle != 0 {
throw("forcegc: phase error")
}
atomic.Store(&forcegc.idle, 1)
goparkunlock(&forcegc.lock, waitReasonForceGGIdle, traceEvGoBlock, 1)
// this goroutine is explicitly resumed by sysmon
if debug.gctrace > 0 {
println("GC forced")
}
// Time-triggered, fully concurrent.
gcStart(gcTrigger{kind: gcTriggerTime, now: nanotime()})
}
}

可以看到当调用的时候自己给自己加了把锁,然后把自己挂起等待别人唤醒去执行gc,然后看一下 sysmon函数,这个值一般不会改变!

1
2
3
4
5
6
7
8
9
10
11
12
13
14
15
16
17
18
19
20
21
22
23
24
// forcegcperiod is the maximum time in nanoseconds between garbage
// collections. If we go this long without a garbage collection, one
// is forced to run.
//
// This is a variable for testing purposes. It normally doesn't change.
var forcegcperiod int64 = 2 * 60 * 1e9

// Always runs without a P, so write barriers are not allowed.
//
//go:nowritebarrierrec
func sysmon() {
// 。。。。。。。。
// check if we need to force a GC
// 要求第一符合gc周期,第二 forcegc.idle 不为0
if t := (gcTrigger{kind: gcTriggerTime, now: now}); t.test() && atomic.Load(&forcegc.idle) != 0 {
lock(&forcegc.lock)
forcegc.idle = 0
var list gList
list.push(forcegc.g)
injectglist(&list)
unlock(&forcegc.lock)
}
////。。。。。。。。
}

2、malloc gc

1
2
3
4
5
6
7
8
9
10
11
12
13
14
15
16
17
18
19
20
21
22
23
24
25
26
27
28
29
30
31
32
// Allocate an object of size bytes.
// Small objects are allocated from the per-P cache's free lists.
// Large objects (> 32 kB) are allocated straight from the heap.
func mallocgc(size uintptr, typ *_type, needzero bool) unsafe.Pointer {
// ........
// 是否需要gc
shouldhelpgc := false
if size <= maxSmallSize { // 小于32k
if noscan && size < maxTinySize { //小于16字节

} else {

} else {
var s *mspan
shouldhelpgc = true
systemstack(func() {
s = largeAlloc(size, needzero, noscan)
})
s.freeindex = 1
s.allocCount = 1
x = unsafe.Pointer(s.base())
size = s.elemsize
}
// 。。。。。。。
if shouldhelpgc {
if t := (gcTrigger{kind: gcTriggerHeap}); t.test() {
gcStart(t)
}
}

return x
}

这里可以看到需要判断是否需要执行gc,大致如果分配大于32k的对象时都会去check一下gc

3、强制GC

这个行为一般不推荐用户自己去执行,首先他会强制的阻塞程序!所以不推荐,第二个就是go的GC并不会回收实际分配的物理内存,所以依旧是依赖于系统去强制回收!

1
2
3
4
5
6
7
8
9
10
11
12
13
14
15
16
17
18
19
20
21
22
23
24
25
26
27
28
29
30
31
32
33
34
35
36
37
38
39
40
41
42
43
// GC runs a garbage collection and blocks the caller until the
// garbage collection is complete. It may also block the entire
// program.
func GC() {
// We consider a cycle to be: sweep termination, mark, mark
// termination, and sweep. This function shouldn't return
// until a full cycle has been completed, from beginning to
// end. Hence, we always want to finish up the current cycle
// and start a new one. That means:
//
// 1. In sweep termination, mark, or mark termination of cycle
// N, wait until mark termination N completes and transitions
// to sweep N.
//
// 2. In sweep N, help with sweep N.
//
// At this point we can begin a full cycle N+1.
//
// 3. Trigger cycle N+1 by starting sweep termination N+1.
//
// 4. Wait for mark termination N+1 to complete.
//
// 5. Help with sweep N+1 until it's done.
//
// This all has to be written to deal with the fact that the
// GC may move ahead on its own. For example, when we block
// until mark termination N, we may wake up in cycle N+2.

// Wait until the current sweep termination, mark, and mark
// termination complete.
n := atomic.Load(&work.cycles)
gcWaitOnMark(n)

// We're now in sweep N or later. Trigger GC cycle N+1, which
// will first finish sweep N if necessary and then enter sweep
// termination N+1.
gcStart(gcTrigger{kind: gcTriggerCycle, n: n + 1})

// Wait for mark termination N+1 to complete.
gcWaitOnMark(n + 1)

// .......
}

GC测试

1、内存扩容GC测试

这里来测试一下 malloc 的方法

1
2
3
4
5
6
7
8
9
10
11
12
13
14
15
16
17
18
19
20
21
22
package main

import (
"fmt"
"time"
)

var (
appender = make([][]byte, 0, 100)
)
// GODEBUG=gctrace=1
func main() {
ticker := time.NewTicker(time.Second * 1)
count := 0
alloc := 4 << 20
for {
<-ticker.C
appender = append(appender, make([]byte, alloc))
count++
fmt.Printf("第%d次分配空间: %dm\n", count, alloc>>20)
}
}

1、执行,配置 GOGC=100 GODEBUG=gctrace=1, 更多关于GODEBUG的配置是 https://golang.org/src/runtime/extern.go

1
2
3
4
5
6
7
8
9
10
11
12
13
14
15
16
17
18
19
20
21
22
➜  gc git:(master) ✗ GOGC=100 GODEBUG=gctrace=1 bin/app
第1次分配空间: 4m
gc 1 @1.001s 0%: 0.010+0.19+0.023 ms clock, 0.12+0.11/0.060/0.11+0.28 ms cpu, 4->4->4 MB, 5 MB goal, 12 P
第2次分配空间: 4m
gc 2 @2.003s 0%: 0.003+0.082+0.024 ms clock, 0.040+0.060/0.019/0.059+0.29 ms cpu, 8->8->8 MB, 9 MB goal, 12 P
第3次分配空间: 4m
第4次分配空间: 4m
gc 3 @4.005s 0%: 0.021+0.20+0.009 ms clock, 0.25+0.10/0.099/0.12+0.11 ms cpu, 16->16->16 MB, 17 MB goal, 12 P
第5次分配空间: 4m
第6次分配空间: 4m
第7次分配空间: 4m
第8次分配空间: 4m
gc 4 @8.005s 0%: 0.005+0.19+0.008 ms clock, 0.061+0.10/0.074/0.086+0.10 ms cpu, 32->32->32 MB, 33 MB goal, 12 P
第9次分配空间: 4m
第10次分配空间: 4m
第11次分配空间: 4m
第12次分配空间: 4m
第13次分配空间: 4m
第14次分配空间: 4m
第15次分配空间: 4m
第16次分配空间: 4m
gc 5 @16.005s 0%: 0.015+0.21+0.011 ms clock, 0.18+0.14/0.062/0.15+0.13 ms cpu, 64->64->64 MB, 65 MB goal, 12 P

2、这里可以看到第一次分配就进行了GC,完全符合默认的设置,当内存第二次分配的时候,由于8/4>1进行了gc,那么下一次触发的阈值就会是 16,假如我们将 GOGC=50,继续执行

1
2
3
4
5
6
7
8
9
10
➜  gc git:(master) ✗ GOGC=50 GODEBUG=gctrace=1 bin/app
gc 第1次分配空间: 4m
1 @1.000s 0%: 0.011+0.18+0.016 ms clock, 0.13+0.10/0.024/0.16+0.19 ms cpu, 4->4->4 MB, 5 MB goal, 12 P
第2次分配空间: 4m
gc 2 @2.002s 0%: 0.006+0.27+0.010 ms clock, 0.078+0.12/0.12/0.12+0.12 ms cpu, 8->8->8 MB, 9 MB goal, 12 P
第3次分配空间: 4m
gc 3 @3.001s 0%: 0.006+0.21+0.010 ms clock, 0.083+0.10/0.12/0.11+0.12 ms cpu, 12->12->12 MB, 13 MB goal, 12 P
第4次分配空间: 4m
第5次分配空间: 4m
gc 4 @5.005s 0%: 0.006+0.24+0.012 ms clock, 0.080+0.10/0.055/0.22+0.14 ms cpu, 20->20->20 MB, 21 MB goal, 12 P

可以看到第3次gc的内存是12m,原因是上次gc后堆内存为8m,那么下一次就是 8m*1.5=12m,所以完全符合!

3、假如关闭垃圾回收

1
2
3
4
5
6
7
➜  gc git:(master) ✗ GOGC=off GODEBUG=gctrace=1 bin/app
第1次分配空间: 4m
第2次分配空间: 4m
第3次分配空间: 4m
第4次分配空间: 4m
第5次分配空间: 4m

关于gc日志学习

1
2
3
4
5
6
7
8
9
10
11
12
13
gctrace: setting gctrace=1 causes the garbage collector to emit a single line to standard
error at each collection, summarizing the amount of memory collected and the
length of the pause. The format of this line is subject to change.
Currently, it is:
gc # @#s #%: #+#+# ms clock, #+#/#/#+# ms cpu, #->#-># MB, # MB goal, # P
where the fields are as follows:
gc # the GC number, incremented at each GC
@#s time in seconds since program start,距离程序的启动时间,单位s
#% percentage of time spent in GC since program start,花费时间的百分比
#+...+# wall-clock/CPU times for the phases of the GC, cpu花费的时间
#->#-># MB heap size at GC start, at GC end, and live heap,gc开始-gc结束-存活的对象 (堆内存)
# MB goal goal heap size (全局堆内存大小)
# P number of processors used p的数量

2、强制gc

1
2
3
4
5
6
7
8
9
10
11
12
13
package main

import (
"runtime"
"time"
)

// GOGC=100 GODEBUG=gctrace=1
func main() {
_ = make([]byte, 0, 3<<20)
runtime.GC()
time.Sleep(time.Second * 100)
}

执行

1
2
3
➜  gc git:(master) ✗ GOGC=100 GODEBUG=gctrace=1 bin/app
gc 1 @0.000s 2%: 0.003+0.11+0.006 ms clock, 0.037+0/0.089/0.10+0.080 ms cpu, 3->3->0 MB, 4 MB goal, 12 P (forced)
^C

可以看到结果是堆中最后存活的对象是 0M,可以发现我们申明的那个3m对象被回收,也没有触发系统mem回收!

3、周期清理

这个其实不好测试,因为那个周期值无法做配置!

1
2
3
4
5
6
7
8
9
10
11
package main

import (
"time"
)

// GOGC=100 GODEBUG=gctrace=1
func main() {
_ = make([]byte, 0, 3<<20)
time.Sleep(time.Second * 130)
}

等待120s的到来!……….. 结果没有

获取Runtime信息

​ 使用prometheus 获取 proc信息,必须是linux/windows,所以mac不能使用

1、mem信息

1
2
3
4
5
6
7
8
9
10
11
12
13
14
15
16
17
18
19
20
21
22
23
24
25
26
27
28
29
30
31
32
33
34
35
36
37
38
package main

import (
"fmt"
"github.com/prometheus/procfs"
"os"
"runtime"
)

// GOGC=100 GODEBUG=gctrace=1
func main() {
memInfo()
_ = make([]byte, 0, 3<<20)
memInfo()
runtime.GC()
memInfo()
}

func memInfo() {
stats := runtime.MemStats{}
runtime.ReadMemStats(&stats)
fmt.Printf("%+v\n", stats)
procMem()
}

func procMem() {
p, err := procfs.NewProc(os.Getpid())
if err != nil {
panic(err)
}
procStat, err := p.Stat()
if err != nil {
panic(err)
}
procStat.ResidentMemory() // 进程所占用的RES
procStat.VirtualMemory() // 进程所占用的VIRT
fmt.Printf("res: %dM, virt: %dM\n", procStat.ResidentMemory()>>20, procStat.VirtualMemory()>>20)
}

执行上面函数以下结果

1
2
3
4
5
6
7
8
9
10
11
12
13
14
➜  gc git:(master) ✗ GOGC=100 GODEBUG=gctrace=1  bin/app
{Alloc:158760 TotalAlloc:158760 Sys:69928960 Lookups:0 Mallocs:173 Frees:3 HeapAlloc:158760 HeapSys:66879488 HeapIdle:66535424 HeapInuse:344064 HeapReleased:66469888 HeapObjects:170 StackInuse:229376 StackSys:229376 MSpanInuse:5168 MSpanSys:16384 MCacheInuse:20832 MCacheSys:32768 BuckHashSys:2203 GCSys:2240512 OtherSys:528229 NextGC:4473924 LastGC:0 PauseTotalNs:0 PauseNs:[0 0...] PauseEnd:[0 0 .....] NumGC:0 NumForcedGC:0 GCCPUFraction:0 EnableGC:true DebugGC:false BySize:[{Size:0 Mallocs:0 Frees:0} {Size:8 Mallocs:5 Frees:0} {Size:16 Mallocs:42 Frees:0} ......]}

res: 3M, virt: 211M

{Alloc:3328688 TotalAlloc:3328688 Sys:69928960 Lookups:0 Mallocs:406 Frees:111 HeapAlloc:3328688 HeapSys:66879488 HeapIdle:63250432 HeapInuse:3629056 HeapReleased:63250432 HeapObjects:295 StackInuse:229376 StackSys:229376 MSpanInuse:6528 MSpanSys:16384 MCacheInuse:20832 MCacheSys:32768 BuckHashSys:2203 GCSys:2240512 OtherSys:528229 NextGC:4473924 LastGC:0 PauseTotalNs:0 PauseNs:[0 0 ......] PauseEnd:[0 0 .......] NumGC:0 NumForcedGC:0 GCCPUFraction:0 EnableGC:true DebugGC:false BySize:[{Size:0 Mallocs:0 Frees:0} {Size:8 Mallocs:6 Frees:0} {Size:16 Mallocs:151 Frees:0} .....]}

res: 3M, virt: 211M

gc 1 @0.002s 0%: 0.006+0.17+0.004 ms clock, 0.075+0/0.098/0.20+0.052 ms cpu, 3->3->0 MB, 4 MB goal, 12 P (forced)

{Alloc:158248 TotalAlloc:3345520 Sys:70256640 Lookups:0 Mallocs:656 Frees:484 HeapAlloc:158248 HeapSys:66781184 HeapIdle:66,396,160 HeapInuse:385,024 HeapReleased:62,996,480 HeapObjects:172 StackInuse:327680 StackSys:327680 MSpanInuse:7072 MSpanSys:16384 MCacheInuse:20832 MCacheSys:32768 BuckHashSys:2203 GCSys:2312192 OtherSys:784229 NextGC:4194304 LastGC:1617196841921944000 PauseTotalNs:10675 PauseNs:[10675 0 0 ......] PauseEnd:[1617196841921944000 0 0 0......] NumGC:1 NumForcedGC:1 GCCPUFraction:0.007580984200182396 EnableGC:true DebugGC:false BySize:[{Size:0 Mallocs:0 Frees:0} {Size:8 Mallocs:6 Frees:1} ........]}

res: 3M, virt: 283M

可以看到gc前内存是3m,gc后内存是0m

  • Alloc 158,760->3,328,688->158,248 (和 HeapAlloc 一样)
  • TotalAlloc 158,760-> 3,328,688-> 3,345,520(一共分配的内存)
  • Sys 69,928,960->69,928,960->70,256,640(系统分配的内存,它表示占用操作系统的全部内存!)
  • HeapAlloc 158,760->3,328,688->158,248 (堆分配的内存)
  • HeapSys 66,879,488->66,879,488->66,781,184
  • HeapIdle 66,535,424->63,250,432->66,396,160(未被使用的span字节树,其实就是未被分配的堆内存,当内存被回收时这个数量会增加回收的内存)
  • HeapInuse 344,064->3,629,056->385,024 (正在使用的字节数)
  • HeapReleased 66,469,888->63,250,432->62,996,480 (返还给操作系统的内存,它统计了从idle span中返还给操作系统,没有被重新获取的内存大小.)
  • PauseNs 表示GC停顿时常, PauseNs[NumGC%256] 表示第多少次GC的时长,记录最近256次的GC!
  • NextGC 4,473,924-> 4,473,924 -> 4,194,304, 表示下次GC触发的阈值
  • GCSys 229,376->2,240,512->2,312,192

其他指标讲解请看 https://golang.org/src/runtime/mstats.go

2、监控进程的指标

这里需要使用 github.com/prometheus/procfs 包,很好的解决了跨平台问题!

1
2
3
4
5
6
7
8
9
10
11
12
13
14
15
16
17
18
19
20
package main

import (
"github.com/prometheus/procfs"
"os"
)

func main() {
p, err := procfs.NewProc(os.Getpid())
if err != nil {
panic(err)
}

procStat, err := p.Stat()
if err != nil {
panic(err)
}
procStat.ResidentMemory() // 进程所占用的RES
procStat.VirtualMemory() // 进程所占用的VIRT
}

3、使用prometheus 监控

下面是一个线上服务的metrics

1
2
3
4
5
6
7
8
9
10
11
12
13
14
15
16
17
18
19
20
21
22
23
24
25
26
27
28
29
30
31
32
33
34
35
36
37
38
39
40
41
42
43
44
45
46
47
48
49
50
51
52
53
54
55
56
57
58
59
60
61
62
63
64
65
66
67
68
69
70
71
72
73
74
75
76
77
78
79
80
81
82
83
84
85
86
87
88
89
90
91
92
93
94
95
96
97
98
99
100
101
102
103
104
105
106
107
108
109
110
111
112
113
114
115
116
117
118
119
# HELP go_gc_duration_seconds A summary of the pause duration of garbage collection cycles.
# TYPE go_gc_duration_seconds summary
go_gc_duration_seconds{quantile="0"} 5.6827e-05
go_gc_duration_seconds{quantile="0.25"} 8.1842e-05
go_gc_duration_seconds{quantile="0.5"} 9.8818e-05
go_gc_duration_seconds{quantile="0.75"} 0.000125499
go_gc_duration_seconds{quantile="1"} 0.000555719
go_gc_duration_seconds_sum 0.247680951
go_gc_duration_seconds_count 2366
# HELP go_goroutines Number of goroutines that currently exist.
# TYPE go_goroutines gauge
go_goroutines 50
# HELP go_info Information about the Go environment.
# TYPE go_info gauge
go_info{version="go1.13.5"} 1
# HELP go_memstats_alloc_bytes Number of bytes allocated and still in use.
# TYPE go_memstats_alloc_bytes gauge
go_memstats_alloc_bytes 8.338104e+06
# HELP go_memstats_alloc_bytes_total Total number of bytes allocated, even if freed.
# TYPE go_memstats_alloc_bytes_total counter
go_memstats_alloc_bytes_total 1.3874634688e+10
# HELP go_memstats_buck_hash_sys_bytes Number of bytes used by the profiling bucket hash table.
# TYPE go_memstats_buck_hash_sys_bytes gauge
go_memstats_buck_hash_sys_bytes 1.922436e+06
# HELP go_memstats_frees_total Total number of frees.
# TYPE go_memstats_frees_total counter
go_memstats_frees_total 8.9915565e+07
# HELP go_memstats_gc_cpu_fraction The fraction of this program's available CPU time used by the GC since the program started.
# TYPE go_memstats_gc_cpu_fraction gauge
go_memstats_gc_cpu_fraction 5.2633836319412915e-06
# HELP go_memstats_gc_sys_bytes Number of bytes used for garbage collection system metadata.
# TYPE go_memstats_gc_sys_bytes gauge
go_memstats_gc_sys_bytes 2.398208e+06
# HELP go_memstats_heap_alloc_bytes Number of heap bytes allocated and still in use.
# TYPE go_memstats_heap_alloc_bytes gauge
go_memstats_heap_alloc_bytes 8.338104e+06
# HELP go_memstats_heap_idle_bytes Number of heap bytes waiting to be used.
# TYPE go_memstats_heap_idle_bytes gauge
go_memstats_heap_idle_bytes 5.1625984e+07
# HELP go_memstats_heap_inuse_bytes Number of heap bytes that are in use.
# TYPE go_memstats_heap_inuse_bytes gauge
go_memstats_heap_inuse_bytes 1.0829824e+07
# HELP go_memstats_heap_objects Number of allocated objects.
# TYPE go_memstats_heap_objects gauge
go_memstats_heap_objects 42405
# HELP go_memstats_heap_released_bytes Number of heap bytes released to OS.
# TYPE go_memstats_heap_released_bytes gauge
go_memstats_heap_released_bytes 4.9709056e+07
# HELP go_memstats_heap_sys_bytes Number of heap bytes obtained from system.
# TYPE go_memstats_heap_sys_bytes gauge
go_memstats_heap_sys_bytes 6.2455808e+07
# HELP go_memstats_last_gc_time_seconds Number of seconds since 1970 of last garbage collection.
# TYPE go_memstats_last_gc_time_seconds gauge
go_memstats_last_gc_time_seconds 1.6172457774344466e+09
# HELP go_memstats_lookups_total Total number of pointer lookups.
# TYPE go_memstats_lookups_total counter
go_memstats_lookups_total 0
# HELP go_memstats_mallocs_total Total number of mallocs.
# TYPE go_memstats_mallocs_total counter
go_memstats_mallocs_total 8.995797e+07
# HELP go_memstats_mcache_inuse_bytes Number of bytes in use by mcache structures.
# TYPE go_memstats_mcache_inuse_bytes gauge
go_memstats_mcache_inuse_bytes 83328
# HELP go_memstats_mcache_sys_bytes Number of bytes used for mcache structures obtained from system.
# TYPE go_memstats_mcache_sys_bytes gauge
go_memstats_mcache_sys_bytes 98304
# HELP go_memstats_mspan_inuse_bytes Number of bytes in use by mspan structures.
# TYPE go_memstats_mspan_inuse_bytes gauge
go_memstats_mspan_inuse_bytes 142528
# HELP go_memstats_mspan_sys_bytes Number of bytes used for mspan structures obtained from system.
# TYPE go_memstats_mspan_sys_bytes gauge
go_memstats_mspan_sys_bytes 196608
# HELP go_memstats_next_gc_bytes Number of heap bytes when next garbage collection will take place.
# TYPE go_memstats_next_gc_bytes gauge
go_memstats_next_gc_bytes 1.0362992e+07
# HELP go_memstats_other_sys_bytes Number of bytes used for other system allocations.
# TYPE go_memstats_other_sys_bytes gauge
go_memstats_other_sys_bytes 5.542772e+06
# HELP go_memstats_stack_inuse_bytes Number of bytes in use by the stack allocator.
# TYPE go_memstats_stack_inuse_bytes gauge
go_memstats_stack_inuse_bytes 4.653056e+06
# HELP go_memstats_stack_sys_bytes Number of bytes obtained from system for stack allocator.
# TYPE go_memstats_stack_sys_bytes gauge
go_memstats_stack_sys_bytes 4.653056e+06
# HELP go_memstats_sys_bytes Number of bytes obtained from system.
# TYPE go_memstats_sys_bytes gauge
go_memstats_sys_bytes 7.7267192e+07
# HELP go_threads Number of OS threads created.
# TYPE go_threads gauge
go_threads 48
# HELP process_cpu_seconds_total Total user and system CPU time spent in seconds.
# TYPE process_cpu_seconds_total counter
process_cpu_seconds_total 3875.24
# HELP process_max_fds Maximum number of open file descriptors.
# TYPE process_max_fds gauge
process_max_fds 1.048576e+06
# HELP process_open_fds Number of open file descriptors.
# TYPE process_open_fds gauge
process_open_fds 29
# HELP process_resident_memory_bytes Resident memory size in bytes.
# TYPE process_resident_memory_bytes gauge
process_resident_memory_bytes 7.5575296e+07
# HELP process_start_time_seconds Start time of the process since unix epoch in seconds.
# TYPE process_start_time_seconds gauge
process_start_time_seconds 1.61709350436e+09
# HELP process_virtual_memory_bytes Virtual memory size in bytes.
# TYPE process_virtual_memory_bytes gauge
process_virtual_memory_bytes 2.018103296e+09
# HELP process_virtual_memory_max_bytes Maximum amount of virtual memory available in bytes.
# TYPE process_virtual_memory_max_bytes gauge
process_virtual_memory_max_bytes -1
# HELP promhttp_metric_handler_requests_in_flight Current number of scrapes being served.
# TYPE promhttp_metric_handler_requests_in_flight gauge
promhttp_metric_handler_requests_in_flight 1
# HELP promhttp_metric_handler_requests_total Total number of scrapes by HTTP status code.
# TYPE promhttp_metric_handler_requests_total counter
promhttp_metric_handler_requests_total{code="200"} 25373
promhttp_metric_handler_requests_total{code="500"} 0
promhttp_metric_handler_requests_total{code="503"} 0

核心关注的指标:

​ 7.5575296e+07 含义是 7.5575296*10^7 ,所以转换为 M,快速计算只需要 / 10^6, 所以就 -6即可,也就是7.5575296e+01 所以就是 75M

  • process_resident_memory_bytes - RES 进程所占用的物理内存 (75M)
  • process_virtual_memory_bytes - VIRT 进程所占用的虚拟内存 (Go的虚拟内存往往很大,2G)
  • go_memstats_heap_alloc_bytes - HeapAlloc 堆内存大小(当前堆实际使用的大小 , 8M)
  • go_memstats_next_gc_bytes - NextGC 表示下次触发GC的阈值 (10M)
  • go_memstats_heap_idle_bytes - HeapIdle 表示堆中空闲的内存( 59M)
  • go_memstats_heap_inuse_bytes - HeapInuse表示正在使用的堆内存 (10M,可能包含有碎片,这个就是实际占用的内存,可以参考的,因为空闲内存可能被回收/未被分配的也是可能实际没有分配)
  • process_open_fds 打开的文件 (29)
  • go_goroutines 表示 go的goroutine 个数 (50)
  • go_memstats_buck_hash_sys_bytes 表示hash表中的数据 (8M)

下面是我们公司对于Go服务的监控

这个容器里放的是一个站内信服务,服务部署在容器中4c_4g(宿主机是128G_64C),可以看到24小时内,服务的内存还是相对来说很稳定的,堆内存基本维持在10m-15m左右,gc基本在100us内!

image-20210401145115111

4、使用 net/http/pprof

只需要引入 _ "net/http/pprof"

然后加一行

1
2
3
4
go func() {
// 未占用的端口
http.ListenAndServe(":8080", nil)
}()

1、mem

最后执行一下下面的,也就是当前的 runtime.MemStats, 不用说核心关注 HeapAllocHeapInuse 以及 NextGC , PauseNs , NumGC

1
2
3
4
5
6
7
8
9
10
11
12
13
14
15
16
17
18
19
20
21
22
23
24
25
26
27
28
29
30
31
➜  ~ curl http://localhost:8080/debug/pprof/allocs\?debug\=1 -v

# runtime.MemStats
# Alloc = 457531928
# TotalAlloc = 672404416
# Sys = 556939512
# Lookups = 0
# Mallocs = 24449
# Frees = 23362
# HeapAlloc = 457531928
# HeapSys = 536248320
# HeapIdle = 77873152
# HeapInuse = 458375168
# HeapReleased = 44040192
# HeapObjects = 1087
# Stack = 622592 / 622592
# MSpan = 29512 / 32768
# MCache = 20832 / 32768
# BuckHashSys = 1443701
# GCSys = 17530880
# OtherSys = 1028483
# NextGC = 915023280
# LastGC = 1617268469532778000
# PauseNs = [35105 36373 34839 0 0 0 0 0 0 0 0 0 0 0 0 0 0 0 0 0 0 0 0 0 0 0 0 0 0 0 0 0 0 0 0 0 0 0 0 0 0 0 0 0 0 0 0 0 0 0 0 0 0 0 0 0 0 0 0 0 0 0 0 0 0 0 0 0 0 0 0 0 0 0 0 0 0 0 0 0 0 0 0 0 0 0 0 0 0 0 0 0 0 0 0 0 0 0 0 0 0 0 0 0 0 0 0 0 0 0 0 0 0 0 0 0 0 0 0 0 0 0 0 0 0 0 0 0 0 0 0 0 0 0 0 0 0 0 0 0 0 0 0 0 0 0 0 0 0 0 0 0 0 0 0 0 0 0 0 0 0 0 0 0 0 0 0 0 0 0 0 0 0 0 0 0 0 0 0 0 0 0 0 0 0 0 0 0 0 0 0 0 0 0 0 0 0 0 0 0 0 0 0 0 0 0 0 0 0 0 0 0 0 0 0 0 0 0 0 0 0 0 0 0 0 0 0 0 0 0 0 0 0 0 0 0 0 0 0 0 0 0 0 0 0 0 0 0 0 0 0 0 0 0 0 0]
# PauseEnd = [1617268337687730000 1617268338545459000 1617268469532778000 0 0 0 0 0 0 0 0 0 0 0 0 0 0 0 0 0 0 0 0 0 0 0 0 0 0 0 0 0 0 0 0 0 0 0 0 0 0 0 0 0 0 0 0 0 0 0 0 0 0 0 0 0 0 0 0 0 0 0 0 0 0 0 0 0 0 0 0 0 0 0 0 0 0 0 0 0 0 0 0 0 0 0 0 0 0 0 0 0 0 0 0 0 0 0 0 0 0 0 0 0 0 0 0 0 0 0 0 0 0 0 0 0 0 0 0 0 0 0 0 0 0 0 0 0 0 0 0 0 0 0 0 0 0 0 0 0 0 0 0 0 0 0 0 0 0 0 0 0 0 0 0 0 0 0 0 0 0 0 0 0 0 0 0 0 0 0 0 0 0 0 0 0 0 0 0 0 0 0 0 0 0 0 0 0 0 0 0 0 0 0 0 0 0 0 0 0 0 0 0 0 0 0 0 0 0 0 0 0 0 0 0 0 0 0 0 0 0 0 0 0 0 0 0 0 0 0 0 0 0 0 0 0 0 0 0 0 0 0 0 0 0 0 0 0 0 0 0 0 0 0 0 0]
# NumGC = 3
# NumForcedGC = 0
# GCCPUFraction = 1.2248226722456959e-06
# DebugGC = false
* Connection #0 to host localhost left intact
* Closing connection 0

2、goroutine / thread

1
2
3
4
5
➜  ~ curl http://localhost:8080/debug/pprof/goroutine\?debug\=1 -v
goroutine profile: total 6

➜ ~ curl http://localhost:8080/debug/pprof/threadcreate\?debug\=1 -v
threadcreate profile: total 14

3、配合go tool pprof 命令

​ 主要需要加参数 seconds,默认收集30s,下面例子是10s

1
2
3
4
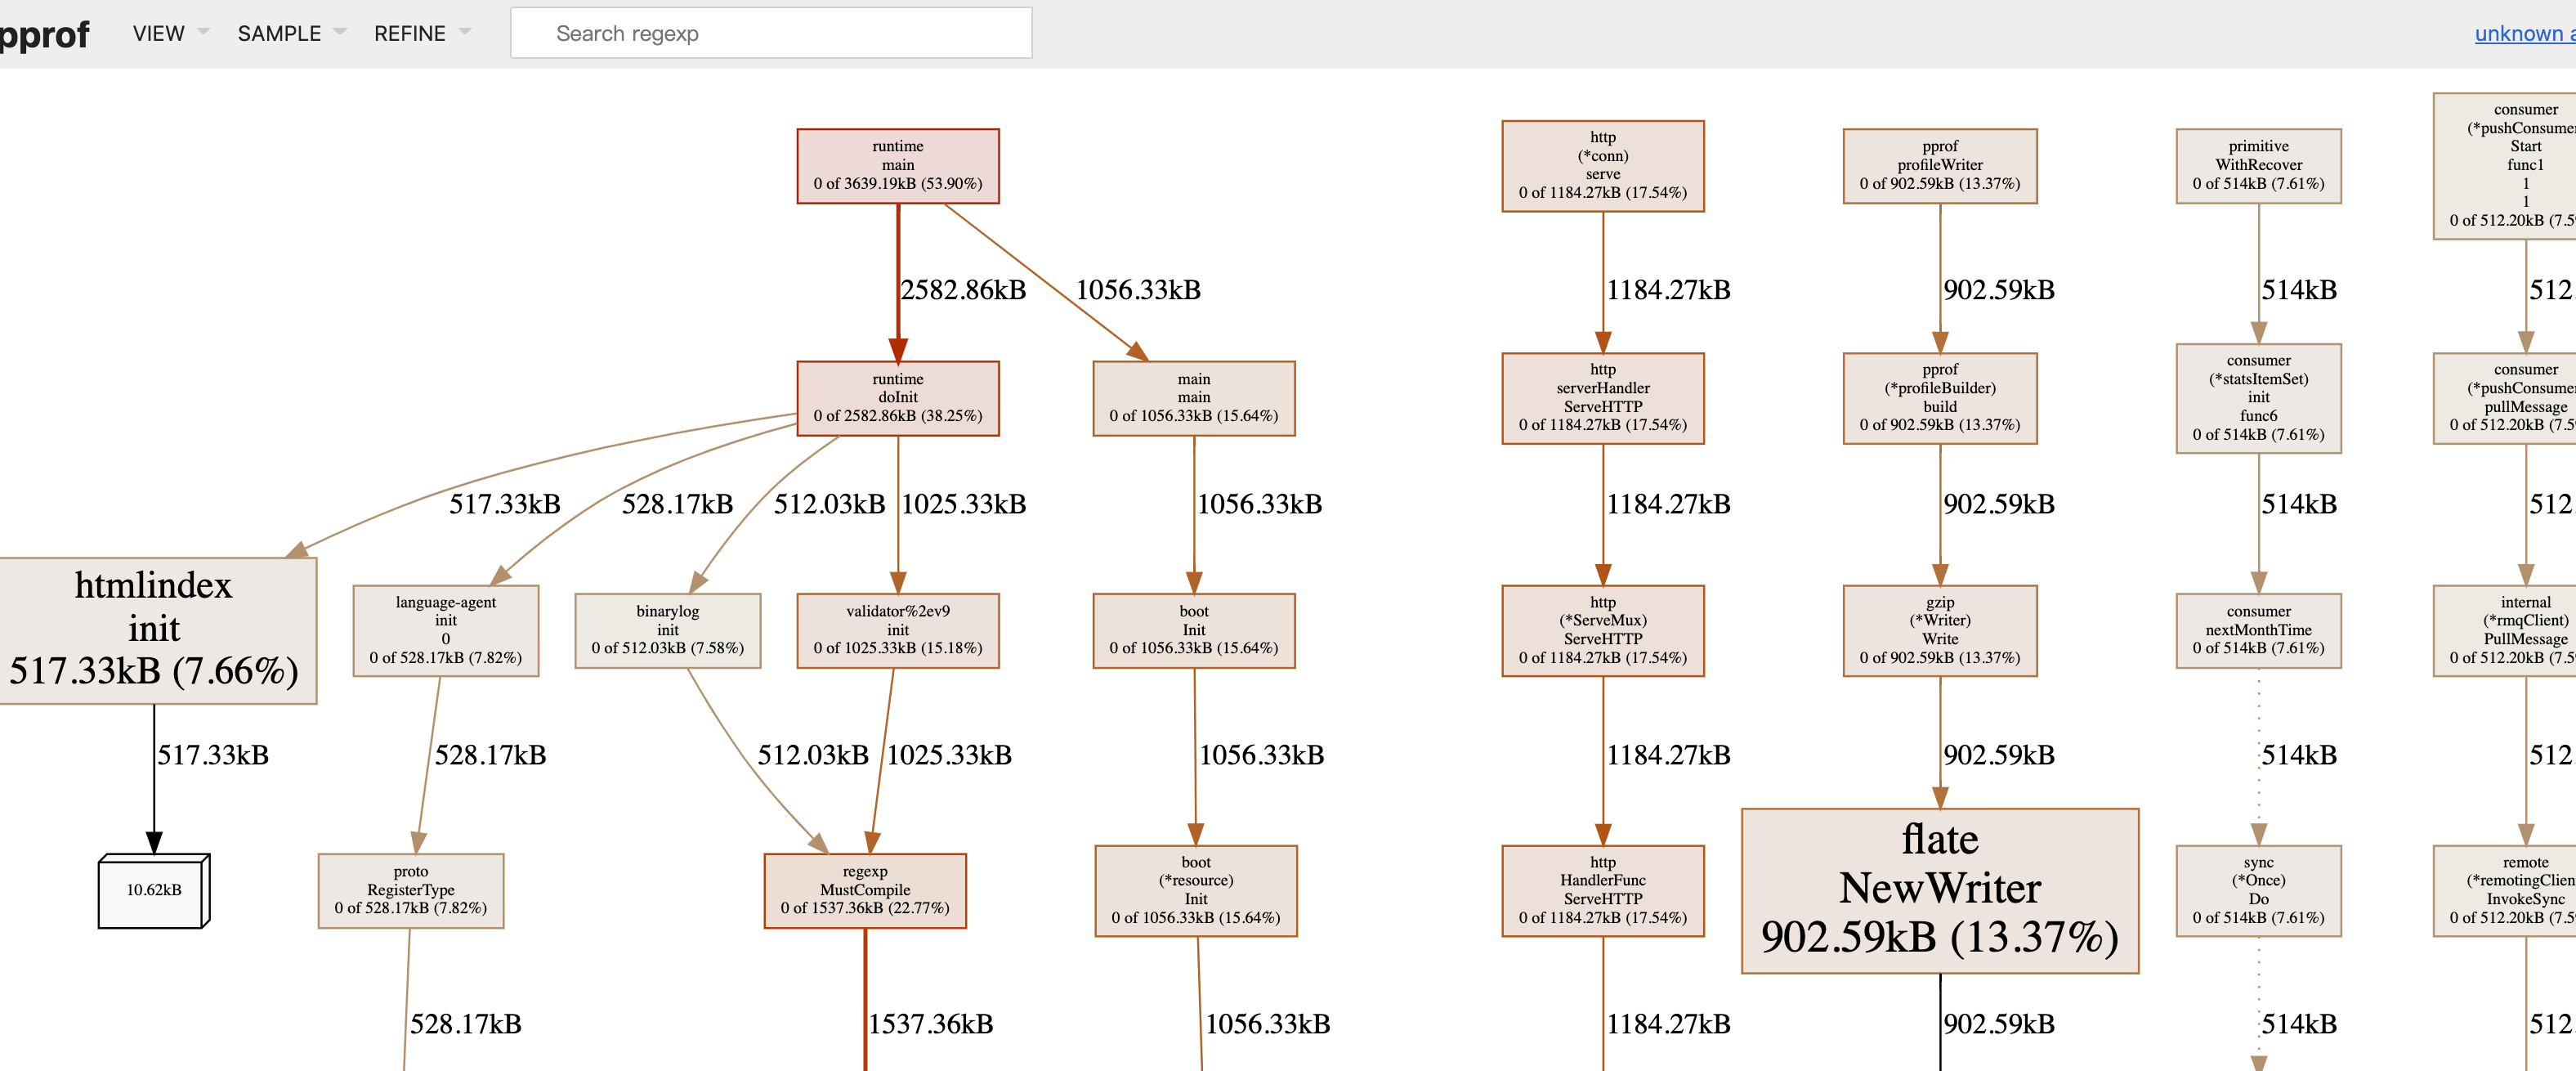
➜  ~ go tool  pprof -http ":8888"  http://localhost:62316/debug/pprof/allocs\?seconds\=10
Fetching profile over HTTP from http://localhost:62316/debug/pprof/allocs?seconds=10
Saved profile in /Users/fanhaodong/pprof/pprof.alloc_objects.alloc_space.inuse_objects.inuse_space.011.pb.gz
Serving web UI on http://localhost:8888

可以看到采集10s最后效果

image-20210401172808989

1、比如查找goroutine 使用率较高!

我们首先要查询 个数

1
2
➜  ~ curl http://localhost:62316/debug/pprof/goroutine\?debug\=1
goroutine profile: total 100

为啥这么多来

1
2
3
4
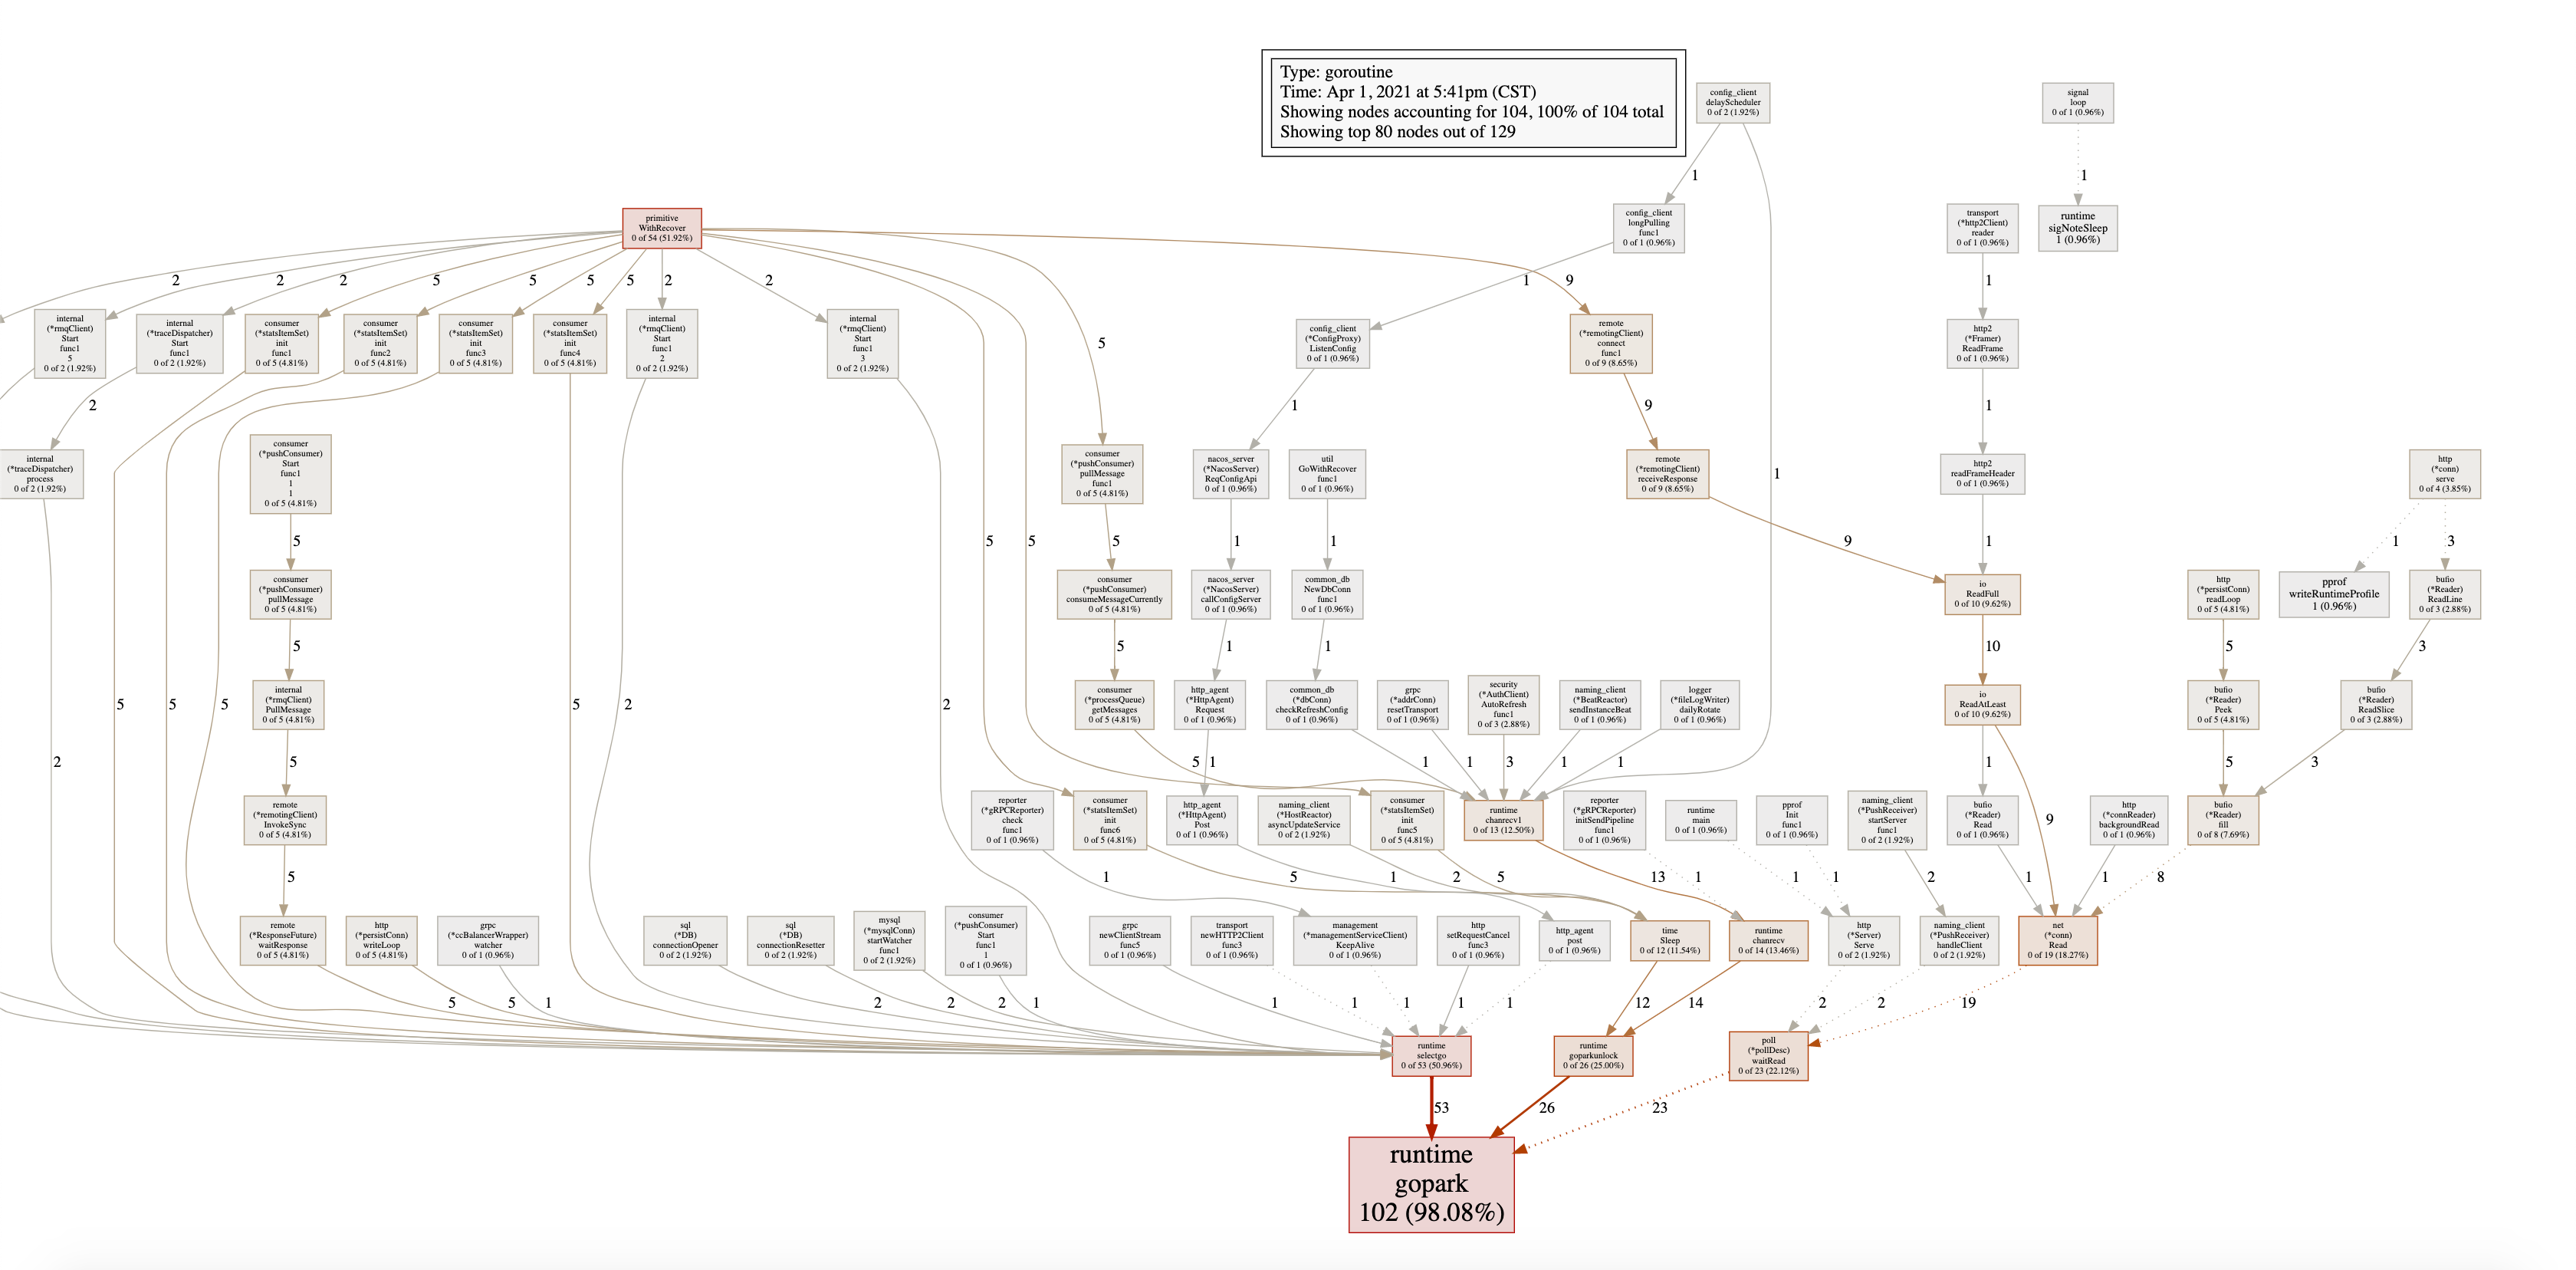
➜  ~ go tool  pprof -http ":8888"  http://localhost:62316/debug/pprof/goroutine\?seconds\=10
Fetching profile over HTTP from http://localhost:62316/debug/pprof/goroutine?seconds=10
Saved profile in /Users/fanhaodong/pprof/pprof.goroutine.001.pb.gz
Serving web UI on http://localhost:8888

可以查看csv图,前提是你是在本地,首先如果在线上服务器,显然是不可能的!线上需要执行

1
➜  ~ go tool pprof   http://localhost:62316/debug/pprof/goroutine\?seconds\=

然后去查看

image-20210401211045488

查看trace

1
2
3
4
5
6
7
8
9
10
11
12
13
14
15
16
17
18
19
20
21
22
23
24
25
26
27
28
29
30
31
32
33
34
35
36
37
38
39
40
41
42
43
44
45
46
47
➜  ~ go tool pprof   http://localhost:62316/debug/pprof/goroutine\?seconds\=5
Fetching profile over HTTP from http://localhost:62316/debug/pprof/goroutine?seconds=5
(pprof) tree
Showing nodes accounting for 102, 98.08% of 104 total
Showing top 80 nodes out of 129
----------------------------------------------------------+-------------
flat flat% sum% cum cum% calls calls% + context
----------------------------------------------------------+-------------
53 51.96% | runtime.selectgo
26 25.49% | runtime.goparkunlock
23 22.55% | runtime.netpollblock
102 98.08% 98.08% 102 98.08% | runtime.gopark
----------------------------------------------------------+-------------
0 0% 98.08% 54 51.92% | github.com/apache/rocketmq-client-go/v2/primitive.WithRecover
9 16.67% | github.com/apache/rocketmq-client-go/v2/internal/remote.(*remotingClient).connect.func1
5 9.26% | github.com/apache/rocketmq-client-go/v2/consumer.(*pushConsumer).pullMessage.func1
5 9.26% | github.com/apache/rocketmq-client-go/v2/consumer.(*statsItemSet).init.func1
5 9.26% | github.com/apache/rocketmq-client-go/v2/consumer.(*statsItemSet).init.func2
5 9.26% | github.com/apache/rocketmq-client-go/v2/consumer.(*statsItemSet).init.func3
5 9.26% | github.com/apache/rocketmq-client-go/v2/consumer.(*statsItemSet).init.func4
5 9.26% | github.com/apache/rocketmq-client-go/v2/consumer.(*statsItemSet).init.func5
5 9.26% | github.com/apache/rocketmq-client-go/v2/consumer.(*statsItemSet).init.func6
2 3.70% | github.com/apache/rocketmq-client-go/v2/internal.(*rmqClient).Start.func1.2
2 3.70% | github.com/apache/rocketmq-client-go/v2/internal.(*rmqClient).Start.func1.3
2 3.70% | github.com/apache/rocketmq-client-go/v2/internal.(*rmqClient).Start.func1.4
2 3.70% | github.com/apache/rocketmq-client-go/v2/internal.(*rmqClient).Start.func1.5
2 3.70% | github.com/apache/rocketmq-client-go/v2/internal.(*traceDispatcher).Start.func1
----------------------------------------------------------+-------------
5 9.43% | github.com/apache/rocketmq-client-go/v2/consumer.(*statsItemSet).init.func1
5 9.43% | github.com/apache/rocketmq-client-go/v2/consumer.(*statsItemSet).init.func2
5 9.43% | github.com/apache/rocketmq-client-go/v2/consumer.(*statsItemSet).init.func3
5 9.43% | github.com/apache/rocketmq-client-go/v2/consumer.(*statsItemSet).init.func4
5 9.43% | github.com/apache/rocketmq-client-go/v2/internal/remote.(*ResponseFuture).waitResponse
5 9.43% | net/http.(*persistConn).writeLoop
2 3.77% | database/sql.(*DB).connectionOpener
2 3.77% | database/sql.(*DB).connectionResetter
2 3.77% | github.com/apache/rocketmq-client-go/v2/internal.(*rmqClient).Start.func1.2
2 3.77% | github.com/apache/rocketmq-client-go/v2/internal.(*rmqClient).Start.func1.3
2 3.77% | github.com/apache/rocketmq-client-go/v2/internal.(*rmqClient).Start.func1.4
2 3.77% | github.com/apache/rocketmq-client-go/v2/internal.(*rmqClient).Start.func1.5
2 3.77% | github.com/apache/rocketmq-client-go/v2/internal.(*traceDispatcher).process
2 3.77% | github.com/go-sql-driver/mysql.(*mysqlConn).startWatcher.func1
1 1.89% | github.com/SkyAPM/go2sky/reporter/grpc/management.(*managementServiceClient).KeepAlive
1 1.89% | github.com/apache/rocketmq-client-go/v2/consumer.(*pushConsumer).Start.func1.1
1 1.89% | github.com/nacos-group/nacos-sdk-go/common/http_agent.post
0 0% 98.08% 53 50.96% | runtime.selectgo
53 100% | runtime.gopark

总结

Go的内存模型和GC策略总结一下,堆属于Go最大的空间,堆大小基本用不完,对于GC来说(因为分配的是虚拟内存,同时会定期释放内存),Go采用的是能复用即复用,也就是说如果我开辟了3M然后回收了3M下次就复用这空间,其次就是Go的堆内存并不会回收,也就是说如果我某一时刻堆空间开辟了很大的空间,其实对于程序来说,内存并不会回收!

Go的GC时间主要是根据堆的大小有关,我们线上来说,Go的堆大小基本很小,不到100M,所以GC时长也不会很大!

Go的GC优化就是能回收的在程序/请求运行结束就立马回收,如果开辟大量内存介意用sync.Pool

其次减少GC频率可以在程序初始化的时候先开辟一个和程序稳定运行时大小的一个空间,那么对于Go来说,会减少GC回收的次数,但是GC回收的时间就会增加!

Go的GC回收时间主要是受机器的CPU限制,cpu越牛逼的机器回收越快!

备注

mem 信息字段

1
2
3
4
5
6
7
8
9
10
11
12
13
14
15
16
17
18
19
20
21
22
23
24
25
26
27
28
29
30
31
32
33
34
35
36
37
38
39
40
41
42
43
44
45
46
47
48
49
50
51
52
53
54
55
56
57
58
59
60
61
62
63
64
65
66
67
68
69
70
71
72
73
74
75
76
77
78
79
80
81
82
83
84
85
86
87
88
89
90
91
92
93
94
95
96
97
98
99
100
101
102
103
104
105
106
107
108
109
110
111
112
113
114
115
116
117
118
119
120
121
122
123
124
125
126
127
128
129
130
131
132
133
134
135
136
137
138
139
140
141
142
143
144
145
146
147
148
149
150
151
152
153
154
155
156
157
158
159
160
161
162
163
164
165
166
167
168
169
170
171
172
173
174
175
176
177
178
179
180
181
182
183
184
185
186
187
188
189
190
191
192
193
194
195
196
197
198
199
200
201
202
203
204
205
206
207
// A MemStats records statistics about the memory allocator.
type MemStats struct {
// 常规统计。

// Alloc 是已分配的堆内存对象占用的内存量(bytes)。
//
// 这个值和 基本和HeapAlloc 一致(看下面)。
Alloc uint64

// TotalAlloc 是累积的堆内存对象分配的内存量(bytes)。
//
// TotalAlloc 会随着堆内存对象分配慢慢增长,但不像 Alloc 和 HeapAlloc,
// 这个值不会随着对象被释放而缩小。
TotalAlloc uint64

// Sys 是从 OS 获得的内存总量(bytes)。
//
// Sys 是下面列出的 XSys 字段的综合。Sys 维护着为 Go 运行时预留的虚拟内存空间地址,
// 里面包含了:堆、栈,以及其他内部数据结构。
Sys uint64

// Lookups 是 runtime 执行的指针查询的数量。
//
// 这主要在针对 runtime 内部进行 debugging 的时候比较有用。
Lookups uint64

// Mallocs 是累积被分配的堆内存对象数量。
// 存活堆内存对象数量是 Mallocs - Frees。
Mallocs uint64

// Frees 是累积被释放掉的堆内存对象数量。
Frees uint64

// 堆内存统计。
//
// 理解堆内存统计需要一些 Go 是如何管理内存的知识。Go 将堆内存虚拟内存空间以 "spans" 为单位进行分割。
// spans 是 8K(或更大)的连续内存空间。一个 span 可能会在以下三种状态之一:
//
// 一个 "空闲 idle" 的 span 内部不含任何对象或其他数据。
// 占用物理内存空间的空闲状态 span 可以被释放回 OS(但虚拟内存空间不会),
// 或者也可以被转化成为 "使用中 in use" 或 "堆栈 stack" 状态。
//
// 一个 "使用中 in use" span 包含了至少一个堆内存对象且可能还有富余的空间可以分配更多的堆内存对象。
//
// 一个 "堆栈 stack" span 是被用作 goroutine stack 的 内存空间。
// 堆栈状态的 span 不被视作是堆内存的一部分。一个 span 可以在堆内存和栈内存之间切换;
// 但不可能同时作为两者。

// HeapAlloc 是已分配的堆内存对象占用的内存量(bytes)。
//
// "已分配"的堆内存对象包含了所有可达的对象,以及所有垃圾回收器已知但仍未回收的不可达对象。
// 确切的说,HeapAlloc 随着堆内存对象分配而增长,并随着内存清理、不可达对象的释放而缩小。
// 清理会随着 GC 循环渐进发生,所有增长和缩小这两个情况是同时存在的,
// 作为结果 HeapAlloc 的变动趋势是平滑的(与传统的 stop-the-world 型垃圾回收器的锯齿状趋势成对比)。
HeapAlloc uint64

// HeapSys 是堆内存从 OS 获得的内存总量(bytes)。
//
// HeapSys 维护着为堆内存而保留的虚拟内存空间。这包括被保留但尚未使用的虚拟内存空间,
// 这部分是不占用实际物理内存的,但趋向于缩小,
// 和那些占用物理内存但后续因不再使用而释放回 OS 的虚拟内存空间一样。(查看 HeapReleased 作为校对)
//
// HeapSys 用来评估堆内存曾经到过的最大尺寸。
HeapSys uint64

// HeapIdle 是处于"空闲状态(未使用)"的 spans 占用的内存总量(bytes)。
//
// 空闲状态的 spans 内部不含对象。这些 spans 可以(并可能已经被)释放回 OS,
// 或者它们可以在堆内存分配中重新被利用起来,或者也可以被重新作为栈内存利用起来。
//
// HeapIdle 减去 HeapReleased 用来评估可以被释放回 OS 的内存总量,
// 但因为这些内存已经被 runtime 占用了(已经从 OS 申请下来了)所以堆内存可以重新使用这些内存,
// 就不用再向 OS 申请更多内存了。如果这个差值显著大于堆内存尺寸,这意味着近期堆内存存活对象数量存在一个短时峰值。
HeapIdle uint64

// HeapInuse 是处于"使用中"状态的 spans 占用的内存总量(bytes)。
//
// 使用中的 spans 内部存在至少一个对象。这些 spans 仅可以被用来存储其他尺寸接近的对象。
//
// HeapInuse 减去 HeapAlloc 用来评估被用来存储特定尺寸对象的内存空间的总量,
// 但目前并没有被使用。这是内存碎片的上界,但通常来说这些内存会被高效重用。
HeapInuse uint64

// HeapReleased 是被释放回 OS 的物理内存总量(bytes)。
//
// 这个值计算为已经被释放回 OS 的空闲状态的 spans 堆内存空间,且尚未重新被堆内存分配。
HeapReleased uint64

// HeapObjects 是堆内存中的对象总量。
//
// 和 HeapAlloc 一样,这个值随着对象分配而上涨,随着堆内存清理不可达对象而缩小。
HeapObjects uint64

// 栈内存统计。
//
// 栈内存不被认为是堆内存的一部分,但 runtime 会将一个堆内存中的 span 用作为栈内存,反之亦然。

// StackInuse 是栈内存使用的 spans 占用的内存总量(bytes)。
//
// 使用中状态的栈内存 spans 其中至少有一个栈内存。这些 spans 只能被用来存储其他尺寸接近的栈内存。
//
// 并不存在 StackIdle,因为未使用的栈内存 spans 会被释放回堆内存(因此被计入 HeapIdle)。
StackInuse uint64

// StackSys 是栈内存从 OS 获得的内存总量(bytes)。
//
// StackSys 是 StackInuse 加上一些为了 OS 线程栈而直接从 OS 获取的内存(应该很小)。
StackSys uint64

// 堆外(off-heap)内存统计。
//
// 下列的统计信息描述了并不会从堆内存进行分配的运行时内部(runtime-internal)结构体(通常因为它们是堆内存实现的一部分)。
// 不像堆内存或栈内存,任何这些结构体的内存分配仅只是为这些结构服务。
//
// 这些统计信息对 debugging runtime 内存额外开销非常有用。

// MSpanInuse 是 mspan 结构体分配的内存量(bytes)。
MSpanInuse uint64

// MSpanSys 是为 mspan 结构体从 OS 申请过来的内存量(bytes)。
MSpanSys uint64

// MCacheInuse 是 mcache 结构体分配的内存量(bytes)。
MCacheInuse uint64

// MCacheSys 是为 mcache 结构体从 OS 申请过来的内存量(bytes)。
MCacheSys uint64

// BuckHashSys 是用来 profiling bucket hash tables 的内存量(bytes)。
BuckHashSys uint64

// GCSys 是在垃圾回收中使用的 metadata 的内存量(bytes)。
GCSys uint64

// OtherSys 是各种各样的 runtime 分配的堆外内存量(bytes)。
OtherSys uint64

// 垃圾回收统计。

// NextGC 是下一次 GC 循环的目标堆内存尺寸。
//
// 垃圾回收器的目标是保持 HeapAlloc ≤ NextGC。
// 在每一轮 GC 循环末尾,下一次循环的目标值会基于当前可达对象数据量以及 GOGC 的值来进行计算。
NextGC uint64

// LastGC 是上一次垃圾回收完成的时间,其值为自 1970 年纸巾的 nanoseconds(UNIX epoch)。
LastGC uint64

// PauseTotalNs 是自程序启动开始,在 GC stop-the-world 中暂停的累积时长,以 nanoseconds 计数。
//
// 在一次 stop-the-world 暂停期间,所有的 goroutines 都会被暂停,仅垃圾回收器在运行。
PauseTotalNs uint64

// PauseNs 是最近的 GC stop-the-world 暂停耗时的环形缓冲区(以 nanoseconds 计数)。
//
// 最近一次的暂停耗时在 PauseNs[(NumGC+255)%256] 这个位置。
// 通常来说,PauseNs[N%256] 记录着最近第 N%256th 次 GC 循环的暂停耗时。
// 在每次 GC 循环中可能会有多次暂停;这是在一次循环中的所有暂停时长的总合。
PauseNs [256]uint64

// PauseEnd 是最近的 GC 暂停结束时间的环形缓冲区,其值为自 1970 年纸巾的 nanoseconds(UNIX epoch)。
//
// 这个缓冲区的填充方式和 PauseNs 是一致的。
// 每次 GC 循环可能有多次暂停;这个缓冲区记录的是每个循环的最后一次暂停的结束时间。
PauseEnd [256]uint64

// NumGC 是完成过的 GC 循环的数量。
NumGC uint32

// NumForcedGC 是应用程序经由调用 GC 函数来强制发起的 GC 循环的数量。
NumForcedGC uint32

// GCCPUFraction 是自程序启动以来,应用程序的可用 CPU 时间被 GC 消耗的时长部分。
//
// GCCPUFraction 是一个 0 和 1 之间的数字,0 代表 GC 并没有消耗该应用程序的任何 CPU。
// 一个应用程序的可用 CPU 时间定义为:自应用程序启动以来 GOMAXPROCS 的积分。
// 举例来说,如果 GOMAXPROCS 是 2 且应用程序已经运行了 10 秒,那么"可用 CPU 时长"就是 20 秒。
// GCCPUFraction 并未包含写屏障行为消耗的 CPU 时长。
//
// 该值和经由 GODEBUG=gctrace=1 报告出来的 CPU 时长是一致的。
GCCPUFraction float64

// EnableGC 显示 GC 是否被启用了。该值永远为真,即便 GOGC=off 被启用。
EnableGC bool

// DebugGC 目前并未被使用。
DebugGC bool

// BySize 汇报了按大小划分的 span 级别内存分配统计信息。
//
// BySize[N] 给出了尺寸 S 对象的内存分配统计信息,尺寸大小是:
// BySize[N-1].Size < S ≤ BySize[N].Size。
//
// 这个结构里的数据并未汇报尺寸大于 BySize[60].Size 的内存分配数据。
BySize [61]struct {
// Size 是当前尺寸级别可容纳的最大对象的 byte 大小。
Size uint32

// Mallocs 是分配到这个尺寸级别的堆内存对象的累积数量。
// 累积分配的内存容量(bytes)可用:Size*Mallocs 进行计算。
// 当前尺寸级别内存活的对象数量可以用 Mallocs - Frees 进行计算。
Mallocs uint64

// Frees 是当前尺寸级别累积释放的堆内存对象的数量。
Frees uint64
}
}

使用初始化内存,减少gc周期测试代码

​ 可以看到这个代码很自由初始化240m内存的时候触发了GC,所以后续分配内存没有发生一次GC

1
2
3
4
5
6
7
8
9
10
11
12
13
14
15
16
17
18
19
20
21
22
23
24
25
26
27
28
29
30
31
32
33
var (
buffer = makeArr(240 << 20) // 240m ,意思就是堆2*240M是不会触发gc的
)
var (
appender = make([][]byte, 0, 100)
)
// GODEBUG=gctrace=1
func main() {
count := 0
alloc := 4 << 20
for x := 0; x < 100; x++ {
appender = append(appender, makeArr(alloc))
count++
time.Sleep(time.Millisecond * 10)

// 到50就回收历史的数据,那么内存达到 480m的时候就会触发gc,所以这个程序结束后内存使用一般是在480m左右
if x == 50 {
for index := range appender {
appender[index] = nil
}
println(len(appender))
}
}
}

func makeArr(len int) []byte {
fmt.Printf("分配堆内存: %dM\n", len>>20)
bytes := make([]byte, len)
for index, _ := range bytes {
bytes[index] = 'x'
}
return bytes
}

对比一下使用buffer和不使用buffer的gc总时间

分配buffer的gc次数两次

1
2
3
4
5
gc 1 @0.009s 0%: 0.016+191+0.034 ms clock, 0.064+0.007/0.13/191+0.13 ms cpu, 240->240->240 MB, 241 MB goal, 4 P
gc 2 @1.251s 0%: 0.030+8.8+0.025 ms clock, 0.12+0/0.13/8.6+0.10 ms cpu, 468->468->264 MB, 480 MB goal, 4 P

# gc时间
283700 302700 =586400 ns

未分配buffer的gc

1
2
3
4
5
6
# 工9次gc
122800 81400 55000 78900 103200 39400 88400 66800 33900 = 669800 ns

# 最后一次gc
gc 9 @1.830s 0%: 0.016+2.2+0.017 ms clock, 0.066+0/0/2.2+0.069 ms cpu, 188->188->188 MB, 192 MB goal, 4 P
res: 263M, virt: 355M

所以整体来说,gc时间基本一致,但是降低gc次数也是一个不错的选择

参考

https://xenojoshua.com/2019/03/golang-memory/

本人坚持原创技术分享,如果你觉得文章对您有用,请随意打赏! 如果有需要咨询的请发送到我的邮箱!